Introduction
Profiler4j
is an open-source
CPU profiler for Java. To get started, just follow the
tutorial or see some
screenshots.
Notice that this project is
in beta stage
and still have some bugs. However, as far as I
know, it is fairly stable with typical applications such as
Tomcat
and JBoss. A final hint: if you develop in JDK1.4 or 1.3,
please see this
FAQ.
Features
- Based on bytecode instrumentation.
- You
can
define rules to select which
packages, classes, and methods must be profiled. Even more,
you can change
these rules without restarting your application. Only
profiled
methods are instrumented. The remainng code truly runs at 100%
of the original speed. Thanks to JVMTI
(introduced in J2SE1.5), Profiler4j can redefine
classes as many times as needed while the JVM is running.
- Very simple to use: add a
JVM parameter to your
application and you´re ready to go.
- 100% Java. No native
library or
executable is required.
- It has two main parts
- a profiling
agent that runs in the same JVM as your application, and
- a remote
console that connects to the remote agent and allows the
user to view the profiling data and change settings
- Released under the Apache
License v2.0.
-
User-friendly UI:
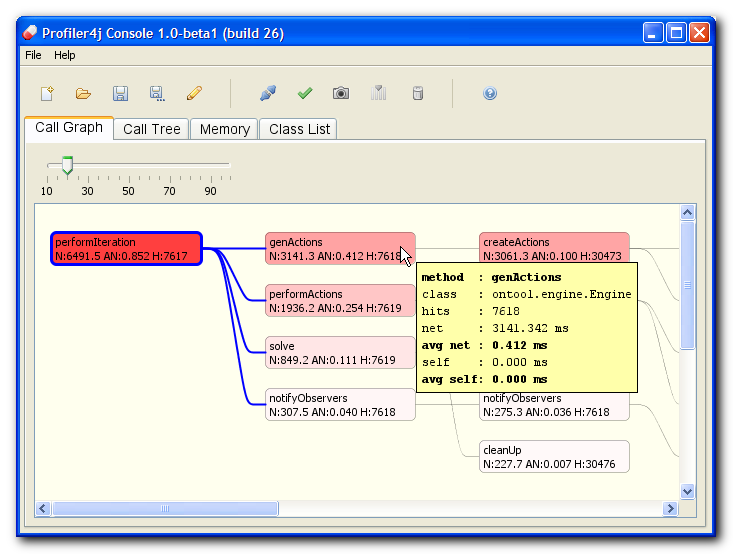
- call graph view that shows the
"hot path",
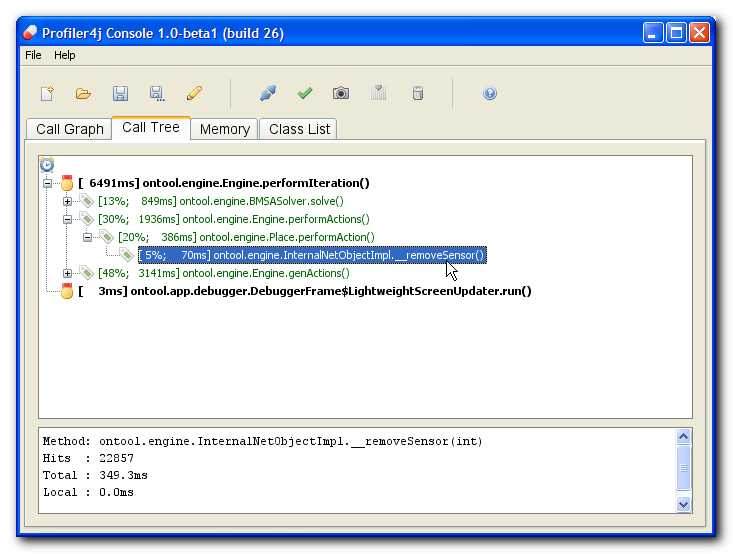
- call tree view (in
progress),
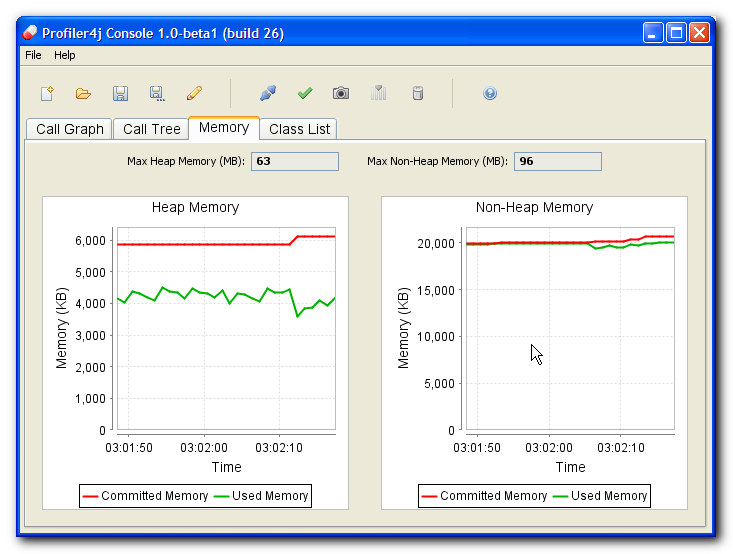
- simple memory monitor,
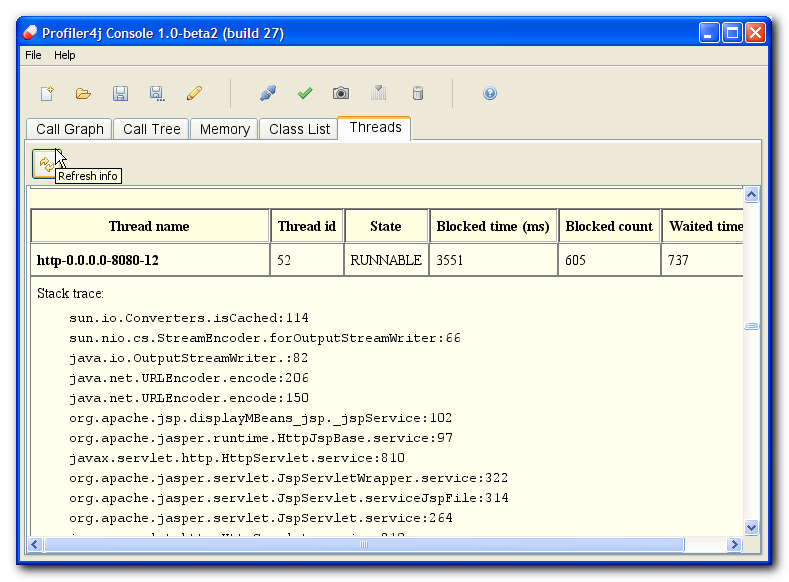
- simple thread status monitor,
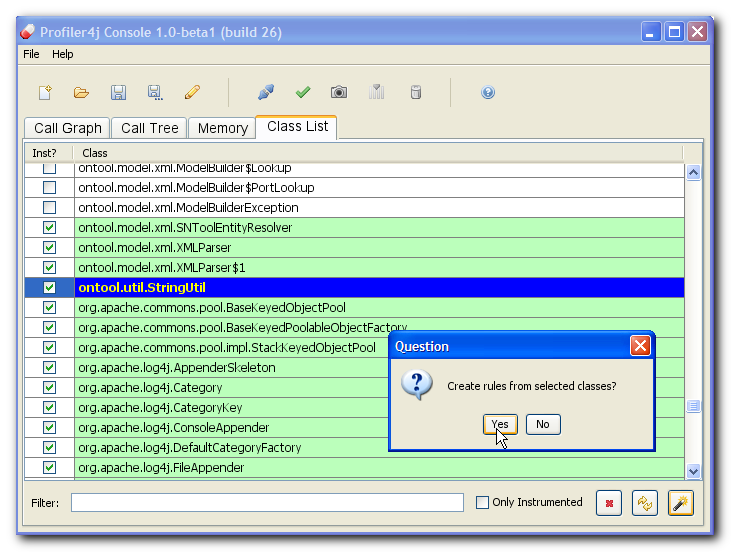
- list of loaded classes that can
be profiled and their
current instrumentation status, and
- load/save settings
Requirements
- The profiled JVM (which runs the agent) and the remote
console
must be run in a 1.5 JVM. However, the agent can profile applications
compiled for previous JDK versions. At the agent side use at
least 1.5.0_04 (JVMTI bugs).
Screenshots

|

|
| Call graph with method details |
Call tree
|

|

|
| Memory
monitor |
Class list with instrumentation
status
|
 |

|
| Profiling rules
being edited |
Thread
monitoring in JBoss
|
Tutorial
(Step 1) Download and Install
Download the latest release
here
and unzip it to your disk (
c:\
for instance). You can also
checkout
the souces from CVS and build it from scratch. In
this case, you'll want
to download and install
ant.
(Step 2) Prepare and Start Your Target Application
In your
target application (the one you want to profile), add
the following JVM option, as shown in the command line below (change
the path as needed):
java -javaagent:c:\profiler4j-1.0-beta2\agent.jar com.foo.Main
You should see something in the console such as
[PROFILER4J:0] +---------------------------------------+
[PROFILER4J:0] | Profiler4j 1.0-beta2 (build 26)       |
[PROFILER4J:0] | Copyright 2006 Antonio S. R. Gomes    |
[PROFILER4J:0] | See LICENSE-2.0.txt for more details  |
[PROFILER4J:0] +---------------------------------------+
[PROFILER4J:0] Listening on port 7890...
[PROFILER4J:0] JVM waiting connection from Profiler4j Console...
You may need to increase the maximum heap as well by using -Xmx128m
(default is 64m). You can also pass aditional parameters to the agent:
- waitconn: if true (default) will cause the application to
wait the connection from the console. This is the recommended way
because it's faster.
- verbosity: defines the level of information printed to
stdout by the profiler agent (default is 1)
- enabled: if set to false simply disable the profiler
(default is true. This is
useful if you want to disable the profiler without removing the all
settings from the command line.
- port: defines the port to listen (default is 7890)
To use these options simply add them after a '=' (no spaces allowed):
java -javaagent:agent.jar=waitconn=false,verbosity=1 com.foo.Main
(Step 3) Start the Profiler4j Console
Execute the following command to open the remote console:
java -jar c:\profiler4j-1.0-beta2\console.jar
In Windows you may be able to simply double click the jar.
(Step 4) Customize Profiling Rules
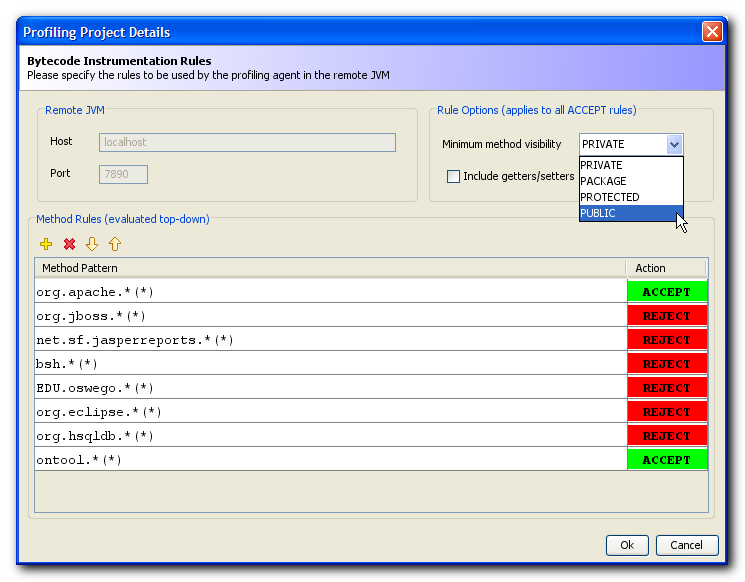
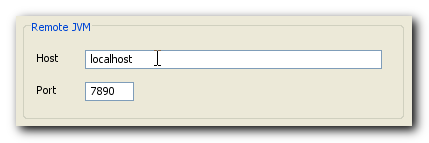
Perform any changes to the profiling rules before you connect, such as
the host and port. Also, you can use the load/save buttons to manage
your settings.
(Step 5) Connect to the remote JVM and Gather Stats
Connect to the target JVM:
Once you connect to the remote JVM the profiled application continues
its startup as expected. From this moment on you can take
snapshots and reset counters as you wish.
Also,
if you change profiling
setttings you can activate them while the JVM is running. Just
press the "Apply" button and wait for it to complete. Depending on the
number of classes this operation can take from a few seconds to a few
minutes. Notice that this will force a stats reset.
The main window has a toolbar with the core
actions and four tabs:
- Call
Graph: shows
the statistics as a graph. Redness measures the total net time (elapsed
time between calls, including calls to another methods). Just move the
mouse cursor over
some method to see its details. You can see the time spent in child
methods by moving the cursor over a selected link.
- Call
Tree: shows the
statistics as a simple tree
- Memory:
shows a
simple x-y graph with some memory info.
- Class
List: lists
all classes the profiler can profile. Additionally, you use it
to
create profiling rules just by selecting a group of classes and
pressing
the appropriate button in the toolbar (at the bottom).
Further descriptions for the toolbar buttons:
- Connect/disconnect :
If disconnected, attaches the console to a remote JVM. Notice that,
once the connection
is established, the console will automatically activate the current set
of profiling rules. Likewise, just before disconnecting,
the console will undo any bytecode manipulation it eventualy
requested to the agent, leaving the remove at JVM full speed again (0%
performance loss).
- Take
snapshot:
requests a snapshot that contains all currently profiled methods.
- Reset
counters:
Resets all collected times, number of hits, etc. Use this button
whenever you are to start a sequence of operations in your profiled
application (before an Use Case, for instance)
- Edit
profiling rules:
Allows the user to specify which (and how) classes should be
profiled by
the agent. Notice that this has no effect until you activate the rules.
- Apply
profiling rules:
Activates the current profiling rules. Notice that this operation may
require from some seconds to some minutes complete depending on the
number of
classes.
- Run
Garbage Collector:
Runs the GC in the remote JVM.
Rule of Thumb:
Configure the profiling rules as restrictive as possible before you
connect to the remote JVM. This has two effects: first, it decreases
the preparation time and, second, it provides a more accurate report on
how your application performs. It's interesting to keep in mind,
however, that you can change the profiling rules (and apply
them) while your application is running.
Known Bugs and Limitations
- The Call Tree View may report wrong values (with recursive
methods, AFAIK)
- Core java classes (java.*, javax.*) and some other packages
(org.xml.*,org.jaxen.*, etc.) are not profiled. I just disabled these
packages until I find a good reason to profile them.
- Constructors and static initializers are not profiled. That's a
minor problem
because most of the work is done by normal methods anyway.
- The agent makes heavy usage of monitors, which may impose a huge
overhead. I'm working on a lock-free version of the agent that will
perform much better in multi-threaded applications.
- Sometimes the JVM cannot redefine a class and throws a
java.lang.InternalError. I´m still trying to figure out
what´s the matter. This is not really critical because the agent
catches
the error and then proceeds to the next class. In this case, just
create a rule to reject
that class and you´ll be fine until I can provide a fix.
FAQs
FAQ1: How can I profile applications developed
in JDK 1.3 and 1.4?
The only requirement is:
you must be able to take your
compiled code and run it in a 1.5 JVM. Your
application does not need to be compiled in the same version. You can
develop in 1.4 (even 1.3) as usual and switch to 1.5 only during the
profiling session. If a 1.5 JVM does not break your code then you'll be
ok. In very rare cases this may occur though (see this
thread
in the forum for some tips).
FAQ2: How to profile applications in JBoss and
Tomcat?
References
java.lang.instrument:
The Javadoc for the agent interface.- Instrumentation:
Modify Applications with Java 5 Class File Transformations
(R. J. Lorimer, JavaLobby, June 2005): One of the few sources of
information about the Java 5 agent interface.
- Build
your own profiling tool (Andrew Wilcox, Senior Architect,
MentorGen LLC, Mar 2006). Pretty nice article on a real world example.
At least for me, this was my inspiration on how to create a portable
profiler.
- Kelly
O'Hair's Blog: Bytecode Instrumentation (BCI) (Kelly O'Hair's
Blog, May 2005). Interesting read from one of the guys who wrote the
JVMPI/TI demos.
- Open
Source ByteCode Libraries in Java. Review of BCI libraries.
- Other open-source projects based on
JVMTI:
- JIP — The
Java Interactive Profiler. A simple, portable and fast profiler.
Also, it has a text-based remote interface. Fairly active project,
created by Andrew Wilcox. It's worth a try.
- Yet Another
Java Profiler. Another profiler which looks similar to Profiler4j,
except it uses the native interface to JVMTI. As far as I know, it's a
college project and has docs in Dutch only.
- Comercial tools
- JProbe
Freeware Edition: this is a very cool CPU profiler that supports
Java 1.5, 1.4. and 1.3, but has some problems with some newer 1.5
JVM´s. Anyway, it´s free and works well if you can't use
Profiler4j.
- Sites that list profilers and related tools
About Me
I have a Master's Degree in
Electrical Engineering. Also, I am
a
PhD candidate and plan to finish all requirements this year at the
State University of Campinas (
DCA-FEEC-
UNICAMP - Brazil). On the
business side, I am a senior developer with more than 8
years
of experience in Java. And the last but not the least, it's been a lot
of fun coding Profiler4j. I learnt a lot from it, and I hope you enjoy
it as much as I did.
Last edited at 2006-07-11
 Our
latest release is 1.0-beta2
  Our
latest release is 1.0-beta2